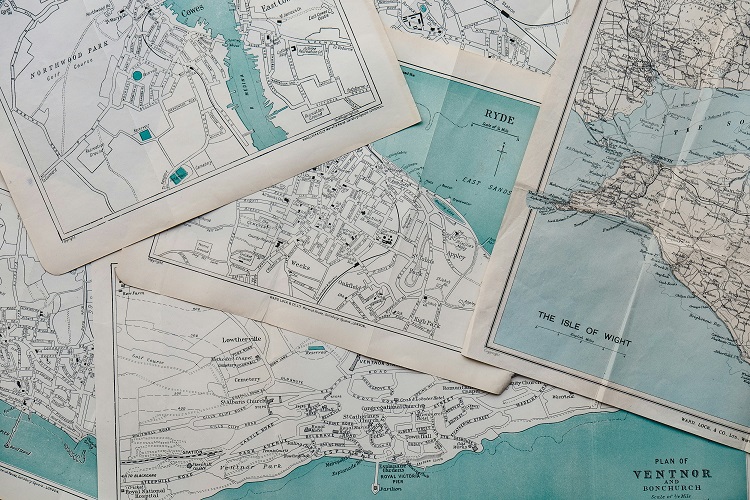
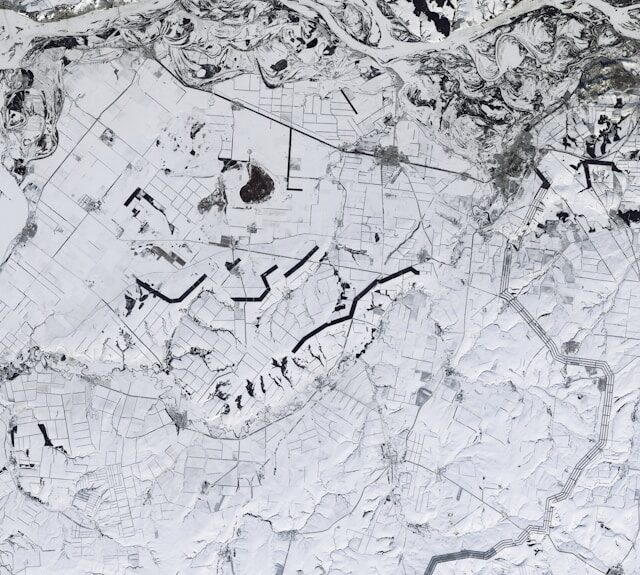
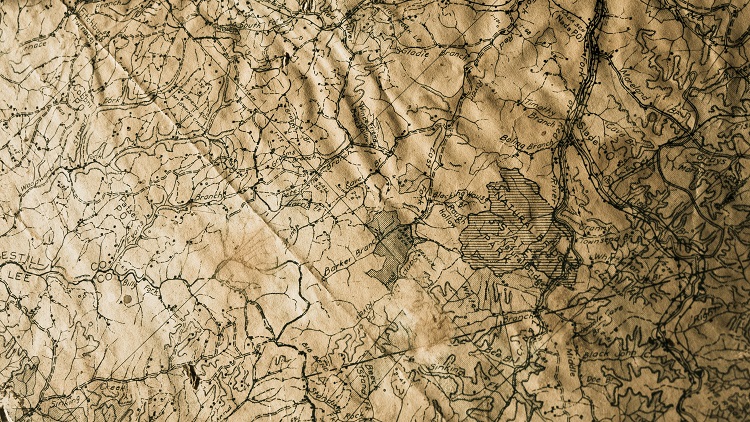
The surface of the Earth can be depicted on a spherical surface (on a globe) and also on a flat surface (on a plan, or on a map). Since it is impossible to cover the entire surface by sight there is a need to imagine on a plane all the elements of the Earth’s surface, which would be impossible to know directly at a given time. This is what a map gives us. A map is an image of the Earth’s surface depicted on a plane. It is the primary source of knowledge about the world, as well as the main tool of the geographer. The map allows you to represent on a flat surface the distribution of objects, and the diversity of various phenomena occurring in space. Thus, a map is an image of the Earth’s surface, or a part of it, depicted on the plane on the basis of a given cartographic representation, at a certain scale, and with the help of conventional graphic signs.

Due to the sphericity of the Earth, it would be more natural to present all the news of its surface on a properly reduced sphere surface. However, due to the difficulties in the construction of the globe, its weight, size, and significant practical limitations, it was decided to present accurate images of the entire surface of the Earth, or a part of it, on a plane onto which by special methods the spherical surface of the Earth is transferred at an appropriate reduction. Difficulties also arise in the construction of the map, which is largely due to the spherical shape of the Earth, the existence of irregularities on its surface, and the need to generalize the image caused by the reduction from the original. If we were to leave the same amount of content (e.g., roads, towns, street names once places) on a map reduced accordingly, it would become unreadable due to the excessive amount of information. Thus, there is a need to generalize the map, i.e. reduce its content. Generalization of the map consists in simplification and generalization of the drawing, omission of finer, less significant elements while maintaining and even intensifying the characteristic features. The degree of generalization and selection of content is determined not only by the scale of the map, but also by its purpose. There are two basic methods of generalization
- Quantitative generalization- omission of less important elements, e.g., removal of minor corners, elimination of smaller settlement forms, simplification of shoreline alignment
- Qualitative generalization- consisting in generalizing the elements present on the map, for example, the combination of neighborhoods of one city, or the representation of this city by geometric signs.
History of the map
The science that deals with maps, their components, and methods of map construction is cartography. The main reason for the formation, and development of this science was the practical needs of human society arising in connection with the development of agriculture, administration, industry, etc. Some researchers claim that the emergence of maps is older than the art of writing. Already primitive peoples used drawings depicting their immediate surroundings. Modern tribes living in Siberia or the Inuit also show the ability to construct primitive maps. In ancient times, plans were made for the cities of Babylonia. The Phoenicians and Carthaginians constructed numerous nautical maps, unfortunately not preserved today.
Cartographers of Egypt made topographical sketches as early as the second millennium BC. They were made on the basis of measurements of field boundaries. The establishment in about 320 BC of the Egyptian School of Alexandria-an influential center of learning with the world’s largest library-contributed significantly to the development of cartography. Egyptian maps were used by such Greek geographers as Herodotus and Eratosthenes. The latter just used Egyptian maps for his measurement of the Earth’s circumference. One of the greatest geographers and also cartographers of antiquity was Claudius Ptolemy, a Greek scholar who was educated in Alexandria. He is the author of the monumental work Geography, much of which is devoted to issues related to the construction of maps and globes. Ptolemy’s main contribution to cartography is to give maps a mathematical basis in the form of a system of meridians and parallels, and the orientation of maps in a northerly direction. Older maps were oriented mostly toward the east.
Numerous Arab travelers, and Chinese travelers contributed to the development of cartography by creating nautical maps of the areas they discovered. Originally, nautical maps were plotted by replacing the system of meridians and parallels with the wind rose. Such maps enabled sailors to determine the direction of navigation, while calculating distances was facilitated by an appropriate scale. These maps, called compass maps, were used most extensively in the Middle Ages. The period of intensive development of the art of map drawing was the Renaissance. This development was mainly determined by the geographical discoveries carried out at that time, as well as the invention of printing.
Thus, the possibility of multiplying maps was obtained. One of the more distinguished cartographers in the history of mankind was Gerard Mercator, a Flemish cartographer and geographer. He is considered the founder of modern cartography. His main contribution was the creation of a solid mathematical basis for the development of cartography and the elimination of the mistakes made by Ptolemy. Mercator constructed a map in the 16th century that became very useful for sailing, since the angles on this map were depicted without distortion. In the centuries that followed, numerous maps were made using ever new mappings. The development of the level method was a turning point in the 18th century.
Nineteenth-century maps were created mainly as a result of exploration trips to unknown corners of the world. The beginning of the 20th century brought a number of great inventions among them radio and aviation. The use of radio made it possible to mark longitude more accurately, aviation made it possible to make maps based on aerial photographs. Nowadays, maps are drawn on the basis of aerial or satellite photographs. The development of technology has enabled the spread of specialized computer methods for map construction.
The importance of the map for man and its use
A very important feature of a map is its viewability, that is, the possibility of observing various phenomena rendered on a flat surface. Even a very detailed description cannot give such an idea of the distribution of phenomena that a map gives. It is a very valuable working tool at all stages of studying, developing, and changing the Earth’s surface. Due to its great importance, maps are used in a variety of fields of human activity. Every economic department related to the use of the earth’s surface needs suitably accurate maps containing economic news, and providing information. Maps are used, for example, for exploration and exploitation of natural resources, planning and establishment of cities, construction of industrial plants. The role of maps in administration is important. With the help of a map, it is best to reflect the location of towns, communications, communication routes, and the limits of the range of the units concerned (political, or administrative maps). Maps are used extensively for tourism, shipping, and air navigation.
The influence of the map reaches into various fields of knowledge. For example, it is used by astronomers, ethnographers, historians, cultural scientists, sociologists, etc. The map is also one of the most popular means of teaching at all grades. It is mainly used in geography, history, natural and social sciences. It is of great importance in geography, since it makes it possible to study, distribute, and illustrate the variation of phenomena in space. The representation of the differences of phenomena is precisely the main task of geography. The map in various fields of science gives detailed information about the studied area, helps to detect and analyze certain scientific relationships. Through the map, the results of scientific work can also be presented. A plan is also important for human activity. It is a section of a small area depicted on a large scale in a simplified way. Cartographic mappings are not used to construct plans.
A plan usually covers the area of a single city. In addition to the street grid with their names, the plans show the location of the most important objects in the city: monuments, churches, museums, hospitals, as well as transportation lines and their stops and stations. The plan is usually accompanied by an index of streets and more important objects. Since the construction of the plan is not based on cartographic mapping, the plan does not have a meridian system, and parallels. The sheet of the plan is divided by vertical and horizontal lines into numbered squares, which makes it easier to locate individual streets and objects. City plans sometimes also supplement car atlases and road maps, but then they are usually very schematic plans, on a relatively large scale Very large cities are also sometimes depicted on plans published in booklet or book form, like an atlas.
An important feature of the map, which is widely used in practice, is the ability to depict the relief of the earth’s surface. The drawing of the relief of the land greatly enhances the content of the map. The issue of depicting the relief of the land on a map was dealt with as early as in antiquity. The first map that attempted to depict elevation relations was the map of the Egyptian gold mines. It was created in the 13th century BC. On these maps, the relief of the land was depicted by means of so-called mounds, which only informed about the general distribution of elevations. This method consisted of drawing mountains where they occurred. There was no way to read the height or slope of the slopes.
Another way of depicting relief on maps was the line method, which appeared at the end of the 19th century and found wide use in the following century. Here the relief of the land was depicted using dashes. It was recognized that steep areas receive less sunlight than areas with gentle slopes. Therefore, dashes were drawn more densely the greater they represented the slope of the slopes. The vertical plane in the dash method was characterized by black color. The shading method, the construction of which was based on the dash method, was also used to depict the relief.
Shading was a simplification of the line method, mainly due to the fact that the execution of the line drawing was very tedious, while the representation of the relief by the shading method was quite simple and did not require as much time. The shaded method was developed based on so-called oblique lighting. Here it was assumed that the relief received light from the side at an angle of 45°. shadows of varying intensity covered slopes with given exposures. There was a view that the map presented by this method would be more natural, since the terrain is mostly lit from the side. In addition, the side shadow makes it possible to distinguish convex from concave forms in the drawing.
The relief of the terrain is nowadays most often depicted with the help of horizontals. Levels (isohypse) are lines on a map connecting points of equal height. A level (hypsometric) map is a map on which the relief of the land is depicted by means of horizontals. The levelling method was developed in the Netherlands in the first half of the 18th century for depicting depths on river plans. Nowadays, maps of this type are most often used to present elevation. The main advantage of the level method is the ability to read absolute heights, and relative heights. Absolute height is the height measured relative to sea level, the height above sea level ( e.g. 1340 m. above sea level), while relative height is the height measured relative to a point not at sea level. Thus, it is the difference in height of two points (e.g. 45 m.). He constructs a level drawing based on a network of points with a given height above sea level. When plotting level lines, interpolation is used, that is, the determination of intermediate heights between two elevation points.
Based on these points, a given area is intersected by a series of horizontal planes that are at the same height relative to sea level. The intervals between the level planes thus have a constant relative height. Level maps also draw skeleton lines, i.e. conventional lines representing the layout of ridges and valleys. Levels intersect skeleton lines always at right angles. Calculating the height above sea level of a given point on the basis of a level map does not cause much difficulty. Levels of known elevation, or elevation points marked on the map, are used for this purpose. Often, some fixed values of the horizons are bolded (for example, every 50 meters, or every 100 meters).
From the level drawing it is also possible to calculate the difference in height between two points without much difficulty. With the help of level maps, it is possible to accurately read, and calculate the slope of the terrain. The slope of the terrain is expressed by a lower or higher density of level lines. With a weaker slope, the interval between adjacent contour lines is greater. Steep slopes are characterized on a level map by a very small gap between two adjacent levelers.
In order to distinguish the contour lines from the rest of the map, they are usually printed in color. To improve the legibility of the relief drawing on the map, colored stripes are often used between the different horizons. One color denotes a certain range of height above sea level. The scale of colors is chosen so that areas higher up are marked by warm colors ( yellow, brown, brown), while areas lower down are marked by cold colors ( green, blue, white). To read a level map more accurately, and to perform elevation calculations, a topographic profile is used.
This is an auxiliary drawing that shows absolute heights on the vertical axis, while horizontal distances are marked on the horizontal axis. The method of depicting the relief of the terrain by means of horizontals is widely used, since, while giving a plastic image, it also allows the highest accuracy in calculating the height of any point on the map. Today, the level method is the primary way of rendering landforms on a map.
Components and features of the map
Modern maps contain a number of components that can be divided into three groups:
- Mathematical components
- Geographical components
- Off-frame description.
The mathematical components are a set of those elements of a map that make it possible to adequately represent the Earth’s surface in the plane. Thus, the mathematical components are: the scale of the map, the system of meridians and parallels in the appropriate mapping, and the reference points (geodetic warp). Reference points are mainly applied to detailed maps.
This is a set of appropriately selected field points for which the coordinates have been mathematically determined, and therefore plotting them on the map is very accurate. We can divide geodetic grid points into astronomical, triangulation, and elevation points. Some thematic maps such as aeronautical or nautical maps also include the marking of certain directional lines.
Map scale
The basic mathematical component of a map is its scale. It is the ratio of the selected length on the map to the corresponding distance on the ground. Scale is a measure of the diminution of a given map in relation to the actual dimensions on the Earth’s surface. The scale of a map expresses the reduction of lines on the map. Scale does not represent the ratio of the diminution of the dimensions of the surface. It can be represented by a number, or by a drawing. Hence we distinguish between:
- Numerical scale- usually expressed in the form of a mathematical operation, or
in the form of a fraction. The denominator of this fraction gives the degree of diminution of the distance on the map relative to the distance in the field. Thus, the larger is the scale that is expressed by a larger number, and therefore whose denominator is smaller. The larger the scale of a given map, the larger the image of a given area is rendered and the more accurate the map. For example, a scale of 1:100,000 is a smaller scale than 1:50,000 because 1:50,000 is a scale expressed by a larger number (fraction).
Numerical scales appeared only in the first years of the 19th century in connection
with the development of topographic maps
- Denominated scale-is the expression of the scale of a map in the form of a comparison of a unit on the map with the corresponding unit of length in the field, e.g. 1cm= 5km.
- Linear scale (scale)-is a graphical construction of the scale. It is divided into units of length (e.g. meters, kilometers), which are reduced according to the scale, and described. With the help of the scale, it is possible to measure distances from the map, and vice versa, to mark on the map a given distance in the field. To avoid unnecessary counting and possible errors, a linear scale is used in practice. The earliest scale designs were used on nautical maps of the 14th and 15th centuries. A more complicated linear scale design is also encountered, namely the transverse (transversal) scale, which allows to increase the accuracy of the linear scale.
Due to the fact that it is impossible to faithfully represent a spherical surface on a plane, the methods of cartographic projections are subject to certain distortions.
The size of the map scale is always different for each location. However, a constant generalized scale value is assumed for the entire map. For this reason, the concept of local scale, and main scale is introduced. The main scale can be preserved on the map at only one point most often the center, or depending on the characteristics of a particular mapping along the equator, the zero meridian, or along all the parallels. In fact, the size of the scale remains constant only on the plan.


